")
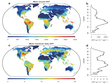
"The Belt and Road countries' external trade system resilience dataset comprehensively reflects the level of resilience of each country's external trade system, and the higher the value of the data, the stronger the resilience of the external trade system of the countries along the Belt and Road. The World Bank's statistical database was used for the preparation of the external trade system resilience data, and the annual data of three indicators, namely the ratio of trade volume to gross national product (GDP), the annual growth rate of exports of goods and services, and the annual growth rate of imports of goods and services of countries along the Belt and Road, were used from 2000 to 2019. On the basis of the year-on-year changes in each indicator, a comprehensive diagnosis based on sensitivity and adaptability analysis was carried out to generate a resilience product for the foreign trade system. Please refer to the documentation for the methodology of preparing the data set. "The resilience dataset of the foreign trade system of countries along the Belt and Road is an important reference for analysing and comparing the current resilience of the foreign trade system of each country.
XU Xinliang
")
Using the dynamic computable general equilibrium model, taking 2012 as the base year, simulate the GDP changes of 48 industrial sectors in Zhangye City from 2013 to 2030, and carry out the prediction and simulation under different scenarios of benchmark growth, low-speed growth and high-speed growth, which can better describe the economic changes and industrial structure changes of various industrial sectors in Zhangye City in Heihe River Basin. The data comes from the input-output table of Heihe River Basin, Zhangye statistical yearbook and Zhangye statistical bulletin of national economic and social development. Since the data source is the publicly released provincial and Municipal Statistical Yearbook, the data has not been cross verified, and the consistency and accuracy of the data need to be verified in the process of data analysis and application. The data set is a macro simulation data set reflecting the economic development of Zhangye City in the middle reaches of the Heihe River Basin. It has a long time series and can provide reference information for the economic development and changes of industrial structure in the middle reaches of the Heihe River Basin.
WU Feng
")
The data set of economic, population, and urbanization growth and change in Qilian mountain area includes the social and economic development indicators of 1949-2020 long-term time series of 5 prefecture-level cities and 14 districts and counties in the Qilian mountain basin, such as the added value of the tertiary industry, population scale, etc. They are the subsets of economic, population, and urbanization growth changes of prefecture-level cities in Qilian mountain and the subsets of county-level economic, population, and urbanization growth changes in Qilian mountain. The data comes from Gansu statistical yearbook, Wuwei statistical bulletin of national economic and social development, Zhangye statistical bulletin of national economic and social development, Jiuquan statistical bulletin of national economic and social development, Jinchang statistical bulletin of national economic and social development, Jiayuguan statistical bulletin of national economic and social development, and social development of Ejina Banner. Since the data source is the publicly released provincial and Municipal Statistical Yearbook, the data has not been cross verified, and the consistency and accuracy of the data need to be verified in the process of data analysis and application. The data set is a macro data set reflecting the growth and change of economy, population, and urbanization in Qilian mountain. It has complete coverage and long-time series. It can provide basic information for the social and economic development and change of Qilian mountain.
WU Feng
")
Food consumption is not only an important indicator to determine the carrying capacity of land resources, but also an important basis to reflect residents' living standards. The food consumption data of the Qinghai Tibet Plateau is based on the data of the Tibet statistical yearbook to sort out the main types and consumption of food in urban and rural areas, such as the consumption of grain, meat, eggs and milk; Combined with the questionnaire survey data of typical counties, the type and quantity data of food consumption in typical counties are statistically sorted out. The data set includes: (1) urban and rural food consumption data on the Qinghai Tibet Plateau; (2) Consumption data of typical counties in Qinghai Tibet Plateau. The data can be used to analyze the spatial differences of food consumption in the Qinghai Tibet Plateau, which is of great significance to the study of land carrying capacity in the Qinghai Tibet Plateau.
YANG Yanzhao
")
"The data set recorded the gross output value of agriculture, forestry, animal husbandry and fishery in Qinghai province in major years, and the statistical data covered the period from 1952 to 2020. The data were classified by main years and regional projects in Xining, Haidong, Haibei Prefecture, Huangnan Prefecture, Hainan Prefecture, Guoluo Prefecture, Yushu Prefecture and Haixi Prefecture. The dataset contains eight data tables, which are: Total Output Value of Agriculture, Forestry, Animal Husbandry and Fishery of Qinghai Province in main years (1952-2020). XLS, Total output value of Agriculture, Forestry, Animal Husbandry and Fishery of Qinghai Province in main years (2012), Total output value of Agriculture, Forestry, Animal Husbandry and Fishery of Qinghai Province in Main years (2013), Total output value of Agriculture, Forestry, Animal Husbandry and Fishery of Qinghai Province in Main years (2014), Total output value of Agriculture, Forestry, Animal Husbandry and Fishery of Qinghai Province in Main years (1952-2020). Gross output value of Agriculture, Forestry, Animal Husbandry and Fishery in major years (2016), Gross output value of Agriculture, Forestry, Animal Husbandry and Fishery in major years (2017), Gross output value of Agriculture, Forestry, Animal Husbandry and Fishery in major years (2018). The data table structure is similar. For example, the total output value of agriculture, Forestry, Animal Husbandry and fishery in the main year (2012) has 7 fields in the data table: Field 1: Year Field 2: gross output value of agriculture, forestry, animal husbandry and fishery Field 3: Agriculture Field 4: Forestry Field 5: Animal husbandry Field 6: Fisheries Field 7: Agriculture, forestry, Animal husbandry and fishery professional and ancillary activities"
AGRICULTURAL AND RURAL Department of Qinghai Province
")
The data set records the added value of agriculture, forestry, animal husbandry and fishery in Qinghai Province in the main years, and the statistical data covers the period from 2012 to 2018. The data are divided by items such as 2006, 2007, 2008, 2009, 2010, 2011 and 2012. The data set contains 7 data tables, which are: added value of agriculture, forestry, animal husbandry and fishery in Main Years (2012), added value of agriculture, forestry, animal husbandry and fishery in Main Years (2013), added value of agriculture, forestry, animal husbandry and fishery in Main Years (2014), added value of agriculture, forestry, animal husbandry and fishery in Main Years (2015), added value of agriculture, forestry, animal husbandry and fishery in Main Years (2016), added value of agriculture, forestry, animal husbandry and fishery in Main Years (2017), Added value of agriculture, forestry, animal husbandry and fishery in Main Years (2018). The data table structure is similar. For example, the data table of added value of agriculture, forestry, animal husbandry and fishery in Main Years (2012) has 7 fields: Field 1: year / Project Field 2: added value of agriculture, forestry, animal husbandry and fishery Field 3: Agriculture Field 4: Forestry Field 5: Animal Husbandry Field 6: Fisheries Field 7: agriculture, forestry, animal husbandry and Fishery Services
AGRICULTURAL AND RURAL Department of Qinghai Province
")
The data set records the statistical data of main livestock and poultry production in Qinghai Province, covering the period from 2008 to 2018. The data are divided by pig, cattle, sheep, poultry and other items. The data set contains 11 data tables, which are: Main Livestock and poultry production table (2008), main livestock and poultry production table (2009), main livestock and poultry production table (2010), main livestock and poultry production table (2011), main livestock and poultry production table (2012), main livestock and poultry production table (2013), main livestock and poultry production table (2014) and main livestock and poultry production table (2015), table of main livestock and poultry production (2016), table of main livestock and poultry production (2017), table of main livestock and poultry production (2018). The data table structure is similar. For example, the data table of main livestock and poultry production (2008) has three fields: Field 1: indicator Field 2: Units Field 3: quantity
AGRICULTURAL AND RURAL Department of Qinghai Province
")
The data set records the basic situation of fishery production in Qinghai Province, and the statistical data covers the period from 2010 to 2018. The data are divided according to the total output of aquatic products, aquaculture area, motor fishing boats, aquaculture fishermen, aquaculture enterprises and other projects. The data set contains 9 data tables, which are: basic situation of fishery production in Qinghai Province (2010), basic situation of fishery production in Qinghai Province (2011), basic situation of fishery production in Qinghai Province (2012), basic situation of fishery production in Qinghai Province (2013), basic situation of fishery production in Qinghai Province (2014), basic situation of fishery production in Qinghai Province (2015) and basic situation of fishery production in Qinghai Province (2016), basic situation of fishery production in Qinghai Province (2017), basic situation of fishery production in Qinghai Province (2018). The data table structure is similar. For example, the data table of basic situation of fishery production in Qinghai Province (2010) has three fields: Field 1: indicator Field 2: Units Field 3: quantity
AGRICULTURAL AND RURAL Department of Qinghai Province
")
The data set records the basic statistical data of green food enterprises and products in Qinghai Province, covering the period from 2004 to 2008. The data are divided by pearl oyster, pearl oyster egg, split beef, Tibetan green salt, high concentration seabuckthorn fruit honey, rapeseed high-grade cooking oil, pea starch, honey and other items. The data set contains five data tables, namely: green food enterprises and products in Qinghai Province (2004), green food enterprises and products in Qinghai Province (2005), green food enterprises and products in Qinghai Province (2006), green food enterprises and products in Qinghai Province (2007) and green food enterprises and products in Qinghai Province (2008). The data table structure is similar. For example, the data sheet of green food enterprises and products in Qinghai Province (2004) has 6 fields: Field 1: Manufacturer Field 2: registered trademark Field 3: output Field 4: output value (10000 yuan) Field 5: product sales region Field 6: contact number
AGRICULTURAL AND RURAL Department of Qinghai Province
")
The data set records the directory data of national and provincial leading enterprises in agriculture and animal husbandry industrialization in Qinghai Province. The statistical data covers the period from 2004 to 2012. The data are divided by Qinghai Sanjiang Group Co., Ltd., Qaidam Longkang high tech Pharmaceutical Co., Ltd., Huangzhong County Foreign Trade Co., Ltd., Guinan County cattle and sheep fattening Comprehensive Development Co., Ltd., Minhe Tianrun industry and Trade Development Co., Ltd., Xunhua Tianxiang Two Pepper company, etc. The data set contains 9 data tables, which are: the list of national and provincial leading enterprises in agriculture and animal husbandry industrialization in Qinghai Province (2004), the list of national and provincial leading enterprises in agriculture and animal husbandry industrialization in Qinghai Province (2005), the list of national and provincial leading enterprises in agriculture and animal husbandry industrialization in Qinghai Province (2006), and the list of national and provincial leading enterprises in agriculture and animal husbandry industrialization in Qinghai Province (2007), list of national and provincial leading enterprises in agriculture and animal husbandry industrialization in Qinghai Province (2008), list of national and provincial leading enterprises in agriculture and animal husbandry industrialization in Qinghai Province (2009), list of national and provincial leading enterprises in agriculture and animal husbandry industrialization in Qinghai Province (2010), list of national and provincial leading enterprises in agriculture and animal husbandry industrialization in Qinghai Province (2011) , the list of national and provincial leading enterprises in agriculture and animal husbandry industrialization in Qinghai Province (2012). The data table structure is similar. For example, the list of national and provincial leading enterprises in agriculture and animal husbandry industrialization in Qinghai Province (2004) has two fields: Field 1: enterprise name Field 2: level
AGRICULTURAL AND RURAL Department of Qinghai Province
 (2006-2014)")
The data set records the total output value and added value of agriculture, forestry, animal husbandry and fishery in Qinghai Province at current price. The statistical data covers the period from 2006 to 2014. The data are divided by total output value of agriculture, forestry, animal husbandry and fishery, agriculture, forestry, animal husbandry, fishery, agriculture, forestry, animal husbandry and fishery services, etc. The data set contains 9 data tables, which are: total output value and added value of agriculture, forestry, animal husbandry and fishery (current price) (2006), total output value and added value of agriculture, forestry, animal husbandry and fishery (current price) (2007), total output value and added value of agriculture, forestry, animal husbandry and fishery (current price) (2008), total output value and added value of agriculture, forestry, animal husbandry and fishery (current price) (2009), total output value and added value of agriculture, forestry, animal husbandry and fishery (current price) (2010), total output value and added value of agriculture, forestry, animal husbandry and fishery (current price) (2011), total output value and added value of agriculture, forestry, animal husbandry and fishery (current price) (2012), total output value and added value of agriculture, forestry, animal husbandry and fishery (current price) (2013), total output value and added value of agriculture, forestry, animal husbandry and fishery (current price) (2014). The data table structure is similar. For example, the data table of total output value and added value (current price) (2006) of agriculture, forestry, animal husbandry and fishery has four fields: Field 1: indicator name Field 2: 2006 Field 3: 2005 Field 4: increase or decrease%
AGRICULTURAL AND RURAL Department of Qinghai Province
")
The data set records the basic situation of rural areas and agricultural production conditions in Qinghai Province. The statistical data covers the period from 2007 to 2013. The data are divided into 8 states, cities and 43 counties and districts according to Xining City, Haidong region, Haibei Prefecture, Huangnan Prefecture, Hainan prefecture, Guoluo Prefecture, Yushu prefecture and Haixi Prefecture. The data set includes rural basic situation and agricultural production conditions (Table 1) (2007), rural basic situation and agricultural production conditions (Table 2) (2007), rural basic situation and agricultural production conditions (Table 3) (2007), rural basic situation and agricultural production conditions (Table 4) (2007), rural basic situation and agricultural production conditions (Table 5) (2007), rural basic situation and agricultural production conditions (Table 6) (2007), rural basic situation and agricultural production conditions (Table 7) (2007), rural basic situation and agricultural production conditions (Table 8) (2007), rural basic situation and agricultural production conditions (Table 1) (2008), rural basic situation and agricultural production conditions (Table 2) There are 105 data sheets in total (2008). The structures of each data sheet are similar. For example, the data sheet of rural basic situation and agricultural production conditions (Table I) (2007) has 20 fields: Field 1: number of township governments Field 2: number of village committees Field 3: number of cooperatives Field 4: number of rural households Field 5: rural population Field 6: rural community infrastructure Field 7: total rural labor resources Field 8: total number of rural employees Field 9: current year outgoing personnel Field 10: education level Field 11: agriculture, forestry, animal husbandry and fishery practitioners Field 12: total cultivated land resources at the beginning of the year Field 13: cultivated land area increased in the current year Field 14: cultivated land area reduced in the current year Field 15: national infrastructure land occupation Field 16: land occupation of rural collective infrastructure Field 17: land occupied by individual farmers Field 18: Reforestation area Field 19: area for returning farmland to grassland Field 20: change cultivated land to garden land
AGRICULTURAL AND RURAL Department of Qinghai Province
")
The data set records the basic situation of leading enterprises in agriculture and animal husbandry industrialization in Qinghai Province, and the statistical data covers the period from 2013 to 2018. The data is divided by enterprise name, enterprise registration type, legal representative, general manager, enterprise address, fixed telephone, mobile phone and fax. The data set contains six data tables, which are: basic information table of leading enterprises in agriculture and animal husbandry industrialization in Qinghai Province (2013), basic information table of leading enterprises in agriculture and animal husbandry industrialization in Qinghai Province (2014), basic information table of leading enterprises in agriculture and animal husbandry industrialization in Qinghai Province (2015), basic information table of leading enterprises in agriculture and animal husbandry industrialization in Qinghai Province (2016), Basic information of leading enterprises in agriculture and animal husbandry industrialization in Qinghai Province (2017), and basic information of leading enterprises in agriculture and animal husbandry industrialization in Qinghai Province (2018). The data table structure is the same. For example, the basic information table of leading enterprises in agriculture and animal husbandry industrialization in Qinghai Province (2013) has 9 fields: Field 1: enterprise name Field 2: enterprise registration type Field 3: legal representative Field 4: General Manager Field 5: business address Field 6: zip code Field 7: fixed telephone, mobile phone and fax Field 8: Web address Field 9: remarks
AGRICULTURAL AND RURAL Department of Qinghai Province
")
The data set records the animal husbandry production in pastoral and semi pastoral counties of Qinghai Province. The statistical data covers the period from 2009 to 2018. The data are divided according to the basic situation, livestock and poultry breeding, output and marketing of livestock products, sales of livestock products and other items. The data set contains 10 data tables, which are: animal husbandry production in pastoral counties and semi pastoral counties (2009), animal husbandry production in pastoral counties and semi pastoral counties (2010), animal husbandry production in pastoral counties and semi pastoral counties (2011), animal husbandry production in pastoral counties and semi pastoral counties (2012), animal husbandry production in pastoral counties and semi pastoral counties (2013), pastoral counties Animal husbandry production in semi pastoral counties (2014), animal husbandry production in pastoral counties and semi pastoral counties (2015), animal husbandry production in pastoral counties and semi pastoral counties (2016), animal husbandry production in pastoral counties and semi pastoral counties (2017), and animal husbandry production in pastoral counties and semi pastoral counties (2018). The data table structure is similar. For example, there are four fields in the data sheet of animal husbandry production in pastoral counties and semi pastoral counties (2010): Field 1: indicator name Field 2: calculation unit Field 3: Pastoral County Field 4: semi pastoral counties
AGRICULTURAL AND RURAL Department of Qinghai Province
")
The data set records the situation of green biological capital enterprises and products in Qinghai Province, and the statistical data covers the period from 2013 to 2017. Green production resources include fertilizers, pesticides, feed and feed additives, veterinary drugs, food additives and other production inputs related to green food production. The data are based on Qinghai Yuhe bio organic fertilizer plant, Qinghai jiangheyuan agriculture and animal husbandry technology development Co., Ltd., Golmud Kangsheng potassium Industry Technology Development Co., Ltd., Qinghai Hongen Technology Co., Ltd., Haibei Chuyuan Biotechnology Development Co., Ltd., Minhe Lvbao forage Technology Development Co., Ltd., Qinghai Jingjie Magnesium Technology Co., Ltd Menyuan Yongxing ecological agriculture and animal husbandry development Co., Ltd., Qinghai Nanjia ecological environment development Co., Ltd. and Haibei Qilian Mountain green organic Biotechnology Development Co., Ltd. The data set contains five data tables, which are: green enterprises and products (2013), green enterprises and products (2014), green enterprises and products (2015), green enterprises and products (2016) and green enterprises and products (2017). The data table structure is similar. For example, there are three fields in the data sheet of green funded enterprises and products (2016): Field 1: enterprise name Field 2: Trademarks Field 3: product
AGRICULTURAL AND RURAL Department of Qinghai Province
 and counties of Qinghai Province (2008-2018)")
The data set records the total output value of agriculture, forestry, animal husbandry and fishery in all States, prefectures, cities and counties of Qinghai Province. The statistical data covers the period from 2008 to 2018. The data are divided into 8 states and cities according to Xining City, Haidong region, Haibei Prefecture, Huangnan Prefecture, Hainan prefecture, Guoluo Prefecture, Yushu prefecture and Haixi Prefecture. The data set contains 11 data tables, which are: total output value of agriculture, forestry, animal husbandry and fishery of counties (prefectures and cities) (2008), total output value of agriculture, forestry, animal husbandry and fishery of counties (prefectures and cities) (2009), total output value of agriculture, forestry, animal husbandry and fishery of counties (prefectures and cities) (2010), total output value of agriculture, forestry, animal husbandry and fishery of counties (prefectures and cities) (2011), total output value of agriculture, forestry, animal husbandry and fishery of counties (prefectures and cities) (2012), total output value of agriculture, forestry, animal husbandry and fishery in counties (prefectures and cities) (2013), total output value of agriculture, forestry, animal husbandry and fishery in counties (prefectures and cities) (2014), total output value of agriculture, forestry, animal husbandry and fishery in Counties (prefectures and cities) (2015), total output value of agriculture, forestry, animal husbandry and fishery in counties (prefectures and cities) (2016), total output value of agriculture, forestry, animal husbandry and fishery in counties (prefectures and cities) (2017), and The total output value of agriculture, forestry, animal husbandry and fishery in (prefecture, city) counties (2018). The data table structure is similar. For example, the data table of total output value of agriculture, forestry, animal husbandry and fishery in (prefecture, city) counties (2008) has five fields: Field 1: Agriculture Field 2: Forestry Field 3: Animal Husbandry Field 4: Fisheries Field 5: agriculture, forestry, animal husbandry and Fishery Services
AGRICULTURAL AND RURAL Department of Qinghai Province
 and counties of Qinghai Province (2008-2018)")
The data set records the added value of agriculture, forestry, animal husbandry and fishery in all States (prefectures, cities) and counties of Qinghai Province. The statistical data covers the period from 2008 to 2018. The data are divided into 8 states and cities according to Xining City, Haidong region, Haibei Prefecture, Huangnan Prefecture, Hainan prefecture, Guoluo Prefecture, Yushu prefecture and Haixi Prefecture. The data set contains 11 data tables, which are: added value of agriculture, forestry, animal husbandry and fishery in counties (prefectures and cities) (2008), added value of agriculture, forestry, animal husbandry and fishery in counties (prefectures and cities) (2009), added value of agriculture, forestry, animal husbandry and fishery in counties (prefectures and cities) (2010), added value of agriculture, forestry, animal husbandry and fishery in counties (prefectures and cities) (2011), and added value of agriculture, forestry, animal husbandry and fishery in counties (prefectures and cities) (2012), added value of agriculture, forestry, animal husbandry and fishery in counties (prefectures and cities) (2013), added value of agriculture, forestry, animal husbandry and fishery in counties (prefectures and cities) (2014), added value of agriculture, forestry, animal husbandry and fishery in counties (prefectures and cities) (2015), added value of agriculture, forestry, animal husbandry and fishery in counties (prefectures and cities) (2016), added value of agriculture, forestry, animal husbandry and fishery in counties (prefectures and cities) (2017), and The added value of agriculture, forestry, animal husbandry and fishery in (prefecture, city) counties (2018). The data table structure is similar. For example, the data table of added value of agriculture, forestry, animal husbandry and fishery in (prefecture, city) counties (2008) has five fields: Field 1: Agriculture Field 2: Forestry Field 3: Animal Husbandry Field 4: Fisheries Field 5: agriculture, forestry, animal husbandry and Fishery Services
AGRICULTURAL AND RURAL Department of Qinghai Province
")
The data set records the output and production of livestock products in different counties of Qinghai Province, and the statistical data covers the period from 2008 to 2018. The data are divided into 8 states and cities according to Xining City, Haidong region, Haibei Prefecture, Huangnan Prefecture, Hainan prefecture, Guoluo Prefecture, Yushu prefecture and Haixi Prefecture. The data set contains 9 data tables, which are: production of livestock products by county (2008), production of livestock products by county (2009), production of livestock products by county (2012), production of livestock products by county (2013), production of livestock products by county (2014) and production of livestock products by county (2015) , the output and production of livestock products by county (2016), the output and production of livestock products by county (2017) and the output and production of livestock products by county (2018) are similar in structure. For example, there are 18 fields in the table of livestock production by county (2015): Field 1: county name Field 2: total meat production Field 3: where: beef Field 4: pork Field 5: mutton Field 6: Poultry Field 7: rabbit meat Field 8: milk production Field 9: milk production Field 10: where: yak milk production Field 11: cashmere production Field 12: goat wool production Field 13: sheep wool production Field 14: where: fine wool production Field 15: semi fine wool production Field 16: honey production Field 17: egg production Field 18: where: egg production
AGRICULTURAL AND RURAL Department of Qinghai Province
")
The data set records the statistical data of the designated wholesale market of agricultural and livestock products in Qinghai Province of the Ministry of agriculture, covering the period from 2007 to 2018. The data are divided by multiple projects, such as Qinghai Xining Haihu Road vegetable and fruit comprehensive wholesale market, Qinghai Ledu County Eastern Qinghai vegetable comprehensive wholesale market, Qinghai Ping'an Haidong agricultural and sideline products wholesale market, Qinghai Golmud Qingken wholesale market, Qinghai Xining Renjie grain and oil wholesale market, and Lejiawan livestock products wholesale market. The data set contains 12 data tables, which are: designated wholesale market of agricultural and livestock products of the Ministry of agriculture (2007), designated wholesale market of agricultural and livestock products of the Ministry of agriculture (2008), designated wholesale market of agricultural and livestock products of the Ministry of agriculture (2009), designated wholesale market of agricultural and livestock products of the Ministry of agriculture (2010), designated wholesale market of agricultural and livestock products of the Ministry of agriculture (2011), designated wholesale market of agricultural and livestock products of the Ministry of agriculture (2012), Designated wholesale market of agricultural and livestock products of the Ministry of agriculture (2013), designated wholesale market of agricultural and livestock products of the Ministry of agriculture (2014), designated wholesale market of agricultural and livestock products of the Ministry of agriculture (2015), designated wholesale market of agricultural and livestock products of the Ministry of Agriculture (2016), designated wholesale market of agricultural and livestock products of the Ministry of agriculture (2017), and designated wholesale market of agricultural and livestock products of the Ministry of agriculture (2018). The data table structure is similar. For example, the data sheet of the designated wholesale market for agricultural and livestock products (2007) of the Ministry of agriculture has four fields: Field 1: sequence number Field 2: market name Field 3: responsible person Field 4: contact number
AGRICULTURAL AND RURAL Department of Qinghai Province
Contact Support
Links
National Tibetan Plateau Data CenterFollow Us

A Big Earth Data Platform for Three Poles © 2018-2020 No.05000491 | All Rights Reserved
|  No.11010502040845
Tech Support: westdc.cn